Question More, Action Knowledge.
Remember, at QMAK, we don’t just teach; we empower. We don’t just inform; we inspire. We don’t just question; we act. Become a Gold Member, and let’s unlock your child’s full potential, one question at a time.
By the end of this lesson, students will:
Understand how to incorporate probabilities into decision trees.
Learn to calculate expected values based on probabilities and outcomes.
Recognize how probabilities affect decision-making.
Apply probabilistic decision trees to real-life scenarios.

Remember last time when we learned about decision trees? We discovered how drawing out our choices like branches of a tree can help us make better decisions. You learned about decision nodes – those squares where we make choices – and chance nodes – the circles where different things might happen.
Today, we’re going to make our decision trees even more powerful by adding something new: probabilities.
But before we dive into that, let’s do a quick check:
Think about the last big choice you made. Maybe it was choosing between different activities, or deciding whether to try something new. Was there anything uncertain about what might happen? For example, if you decided to try out for a sports team, you couldn’t be completely sure you’d make the team, right?

That’s where probabilities come in. When we make decisions, we often have to think about how likely different outcomes are.
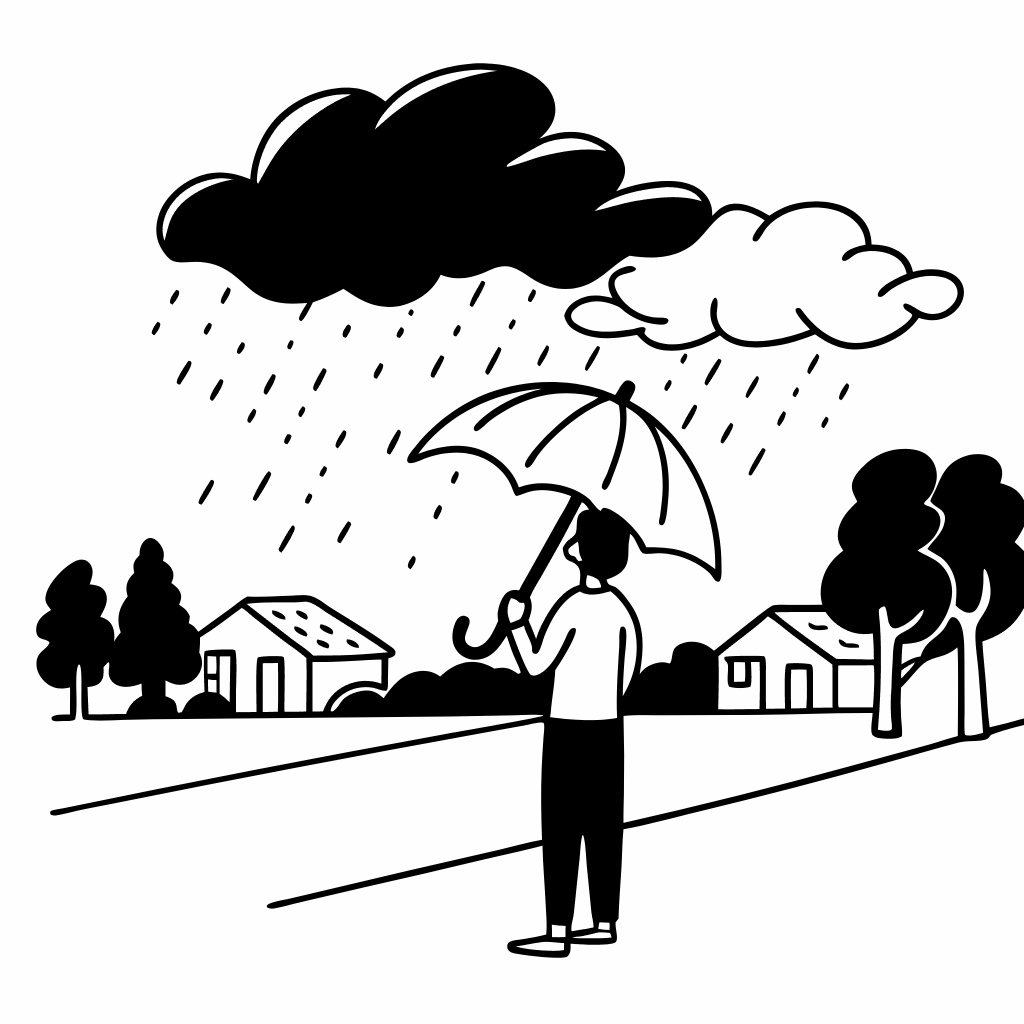
Like when you check the weather forecast and it says there’s a 70% chance of rain – that helps you decide whether to bring an umbrella.
Today, we’re going to learn how to put these chances – these probabilities – right into our decision trees. This will help us make even smarter choices because we’ll be able to see not just what might happen, but how likely each outcome is.
Let me show you what I mean. Remember our test-studying decision tree from last time? We knew studying would make a good grade more likely, but we didn’t say exactly how likely. Today, we’ll learn how to add those numbers to make our decision trees even more helpful.
Are you ready to add this new tool to your decision-making toolbox?
Teaching Note: This opening helps students connect their previous knowledge of decision trees with the new concept of probability while keeping the discussion relatable and engaging.
Remember our story about Sarah and her postcard stamps? Let’s look at it again, but this time we’ll think about the chances of different things happening.
Sarah had a choice to make. She could:
Now, let’s think about this with probabilities. After searching her desk drawer and not finding the stamps, what were the chances she’d find them quickly in another place? Pretty low, right? Let’s put some numbers to it:

And each time she looked and didn’t find them, the chance of finding them in the next place got even smaller.
Here’s something interesting to think about: Even if she did find the stamps, she’d only save 25 cents. But let’s look at what she was giving up:
When we put the probabilities into our thinking, the choice becomes clearer. If there’s only a small chance (let’s say 20%) of finding the stamps quickly, is it worth spending time searching to save 25 cents?
Let’s work this out together:
This is why understanding probabilities helps us make better decisions. When we know something has a low chance of success, we can decide if it’s really worth trying.
What would you have done in Sarah’s situation, now that you can see the probabilities? How do these chances change how you think about the decision?
Teaching Note: This revisited story helps bridge the gap between basic decision trees and those with probabilities, showing how adding numerical chances helps clarify choices.
Let me show you how to make your decision trees even more helpful by adding numbers that tell us how likely different things are to happen.
Remember how we check the weather forecast before going out? When it says there’s a 60% chance of rain, that number helps us decide what to do. Let’s use this example to learn how to put probabilities in our decision trees.
Imagine you’re deciding whether to take an umbrella to school tomorrow. Let’s draw this out together:
Now, let’s learn something really cool called “Expected Value.” It helps us figure out which choice is better by combining the chances of something happening with how good or bad each outcome is.
Let’s calculate it for taking the umbrella:
– If it rains (60% chance): Stay dry = +10 points × 0.60 = +6 points
– If no rain (40% chance): Extra weight = -2 points × 0.40 = -0.8 points
– Total Expected Value = +6 + (-0.8) = +5.2 points
Now for not taking the umbrella:
– If it rains (60% chance): Get wet = -8 points × 0.60 = -4.8 points
– If no rain (40% chance): No weight = +2 points × 0.40 = +0.8 points
– Total Expected Value = -4.8 + 0.8 = -4 points

See how the numbers help us decide? Taking the umbrella has an expected value of +5.2 points, while not taking it has -4 points. The math shows us that taking the umbrella is probably a better choice!
What other decisions could we look at this way? What if we changed the chances of rain to 30%? How would that change our decision?
Teaching Note: Help students understand that while the math might seem complicated, it’s really just a way of thinking through how likely and how important different outcomes are.
Let’s work through a decision many students face: should you study for tomorrow’s test or play your favorite video game? We’ll use probabilities to help make this choice clearer.
Let’s work out the math together!
If you choose to study:
– 80% chance (0.80) of doing well: 0.80 × 10 points = 8 points
– 20% chance (0.20) of struggling: 0.20 × 0 points = 0 points
– Total Expected Value = 8 + 0 = 8 points
If you choose to play video games:
– 30% chance (0.30) of doing well anyway: 0.30 × 10 points = 3 points
– 70% chance (0.70) of struggling: 0.70 × 0 points = 0 points
– Total Expected Value = 3 + 0 = 3 points
Look at that difference! Studying gives you an expected value of 8 points, while playing video games only gives you 3 points. The numbers are telling us that studying is probably a much better choice!


But here’s something cool to think about: What if we changed some of these numbers? Like:
Want to try calculating one of these different scenarios?
Teaching Note: This helps students see how math can guide real-life decisions while keeping the calculations simple and relatable.
Now it’s your turn to create a decision tree with probabilities! Let’s work through this step by step.
First, pick a decision you’re facing right now, or choose from these interesting scenarios:
Let’s use this simple template to build your tree:
Let’s fill it in together:
Then we’ll calculate the expected value for each option, just like we did in our study vs. play example.
Remember:
What decision would you like to map out? Let’s start filling in the template together!
Teaching Note: Guide the student through each step, helping them assign realistic probabilities and values while keeping the math manageable.
Today we learned how to make our decision trees even more powerful by adding probabilities. Let’s look at what we discovered:
We can use numbers to show how likely different things are to happen. Just like checking a weather forecast tells us the chance of rain, we can estimate the chances of different outcomes in our decisions. And when we combine these chances with how good or bad each outcome would be, we can calculate something called “expected value” that helps us compare our choices.
Think about everything we practiced today:
Over the next few days, try using probabilities in your decisions.
Here’s a fun way to practice:

For example, you might write:
“Today I had to decide whether to start my homework right after school or play outside first. I thought there was an 80% chance I’d finish all my homework if I started right away, but only a 40% chance if I played first. Since finishing my homework was worth 10 points to me, starting right away had a better expected value!“
When we meet next time, we’ll learn even more about making smart choices. Bring your examples of using probabilities in your decisions – I’d love to hear how the numbers helped you choose!
This wrap-up reinforces the key concepts while keeping the focus on practical application. The take-home challenge encourages students to continue practicing with probabilities in their daily decisions.
Verse 1:
Draw your tree like we did before
Then add some numbers to explore
Every chance has its percent
Showing how our paths are meant
Eighty, twenty, sixty, ten
Help us see what might happen when
Chorus:
Numbers show which way to go
When the chances matter so
Add them up and you will see
What your best choice might just be
Like a map with chances clear
Making tricky choices near
Verse 2:
Like our friend who searched all day
For stamps to save some cents away
Twenty percent, ten percent, five
Showed the choice was not so wise
When you count the chances through
Better paths come into view
(Chorus)
Bridge:
Multiply your odds and gains
Add them up to see
Which choice might bring
The most to be
(Chorus)
Outro:
So when choices make you pause
Let the numbers guide your way
Adding up each chance because
That’s how better choices stay
Remember, at QMAK, we don’t just teach; we empower. We don’t just inform; we inspire. We don’t just question; we act. Become a Gold Member, and let’s unlock your child’s full potential, one question at a time.