Regression to the Mean

Have you ever had an amazing day where everything just seemed to go your way? Maybe you aced a test you didn’t study much for, won every game you played with your friends, or found a bunch of money on the ground. On days like that, it can feel like you’re unstoppable and that your incredible luck will last forever!

But if you’ve ever experienced a streak of good luck like that, you’ve probably also noticed that things tend to even out over time. After an exceptionally good day, you might have a few more ordinary or even not-so-great days that follow. This is what we call “regression to the mean” – the idea that when something happens that’s way above or below average, the next thing that happens is more likely to be closer to the normal or average outcome.

What is Regression to the Mean?

Regression to the mean is all about how things tend to balance out and return to their typical levels after an extreme high or low. It’s like when you’re playing a game and someone gets an unusually high (or low) score – the chances are that their next score will be closer to their normal, average level of performance.

This happens because many things in life are influenced by both skill and luck (or chance). When you have an exceptionally good or bad result, it’s often because luck played a bigger role than usual. But since luck evens out over time, the next result is more likely to reflect your true, normal level of skill or ability.

Why is Regression to the Mean Important?

Understanding regression to the mean is important for a few key reasons:

  1. It helps us manage our expectations. After a really great success, it reminds us that we might not be able to keep up that same level of performance forever.
  2. It prevents us from overreacting to one-time events. We learn not to get too excited (or disappointed) by a single extreme result, since things will likely balance out again soon.
  3. It helps us appreciate average or consistent performance. We realize that steadily performing at a normal, reliable level is often more valuable than having occasional peaks and valleys.
  4. It teaches us not to judge too quickly. We understand that first impressions or initial results don’t always tell the full story.

One of the best ways to understand regression to the mean is to experience it yourself.

Here are some fun activities to try:

  • Coin Flipping Challenge
    • Flip a coin 10 times and keep track of how many times it lands on heads or tails.
    • Notice how sometimes you’ll get streaks of the same result, but over time, the numbers tend to even out close to 50/50.
  • Basketball Shooting
    • Take 10 shots from different spots on the basketball court and keep track of your makes and misses.
    • You’ll likely have some “hot streaks” where you make several in a row, followed by periods where you miss more shots, evening out your overall percentage.
  • Guess the Number Game
    • One person thinks of a number between 1 and 100, and everyone else takes turns guessing.
    • After each guess, the person reveals whether the number is higher or lower.
    • Notice how the guesses tend to start all over the place but gradually converge towards the actual number as people adjust based on the feedback.

Remember, regression to the mean is all about balance and evening out over time. While streaks of good or bad luck can happen, the key is to recognize them for what they are – temporary departures from the normal or average outcome. By understanding this concept, you’ll be better prepared to appreciate your successes while also maintaining a level head and realistic expectations.

Please note: We now have a longer article on Understanding Regression to the Mean in the “Mental Models” section of our website.

Math Problems on Regression to the Mean

Below are three math problems and critical thinking exercises focused on Regression to the Mean, specifically designed for three age groups: Elementary, Middle School, and High School students. These exercises go beyond standard math problems by encouraging deeper analysis and reflection on how biases can influence decision-making.

The Super Shooter Basketball Challenge (Ages 7 – 10)

This elementary-level problem on regression to the mean encompasses several key categories: Basic Statistics, Data Analysis, and Probability Concepts. It introduces young students to the idea that extreme performances are often followed by more average ones, using the relatable context of a basketball shooting contest. The problem reinforces fundamental math skills like addition, division, and calculating averages while encouraging students to think critically about the role of skill versus luck in performance. 

By analyzing how the “Super Shooters” perform over two days, students begin to grasp the concept that unusually high (or low) results tend to move closer to the average over time. This problem serves as an excellent introduction to more complex statistical concepts, laying the groundwork for understanding variability, sample size effects, and the importance of long-term data in assessing true ability. The inclusion of a bar graph helps students visualize the change in performance, making the abstract concept more concrete and accessible. Additionally, the problem encourages students to think about why results might change over time and how to more accurately measure skill, fostering critical thinking skills that are valuable in many areas of science and everyday life.

The Westview Middle School Sports Analytics Challenge (Ages 11 – 14)

This middle school level problem on regression to the mean encompasses several advanced categories: Statistical Analysis, Data Visualization, Probability Theory, and Sports Analytics. It challenges students to apply mathematical concepts to real-world sports data, reinforcing skills in calculation, graphing, and data interpretation while introducing more sophisticated ideas like correlation coefficients and normal distributions. By analyzing performance data from basketball and soccer teams, students develop a deeper understanding of how exceptional performances tend to be followed by more average ones, a key principle in understanding regression to the mean. 

The problem encourages critical thinking about the differences between peak performance, consistent performance, and long-term averages, introducing concepts that are fundamental in fields like sports science and performance analysis. The inclusion of scatter plots and the creation of a Performance Consistency Index promotes data visualization and index development skills, which are valuable in many areas of data science. This multifaceted approach not only enhances mathematical and analytical skills but also fosters an understanding of how statistical concepts apply to practical decision-making in sports and beyond. The problem serves as an excellent bridge between basic statistics and more advanced concepts in data analysis and predictive modeling, preparing students for future studies in fields like analytics, economics, and social sciences.

Advanced Problem: Regression to the Mean in Clinical Trials and Public Policy (Ages 15 +)

This advanced-level problem on regression to the mean encompasses several sophisticated categories: Statistical Analysis, Clinical Trial Design, Education Policy Evaluation, and Ethical Considerations in Research. It challenges students to apply complex statistical concepts to real-world scenarios in healthcare and education, reinforcing skills in data analysis, experimental design, and critical thinking. By exploring how regression to the mean can impact both clinical trials and policy evaluations, students develop a nuanced understanding of the challenges in interpreting data and making evidence-based decisions. 

The problem introduces advanced statistical techniques such as ANCOVA, Monte Carlo simulations, Bayesian modeling, and hierarchical models, preparing students for high-level work in fields like biostatistics, epidemiology, and policy analysis. The inclusion of ethical considerations encourages students to think beyond pure statistics and consider the real-world implications of statistical misinterpretations. This multifaceted approach not only enhances technical statistical skills but also fosters a deeper understanding of the complexities involved in scientific research and policy-making. The problem serves as an excellent bridge between theoretical statistics and its practical applications in critical fields, preparing students for advanced studies in data science, public health, and social sciences, while also emphasizing the importance of rigorous methodology in addressing societal challenges.

Song: Regression to the Mean

(Verse 1)
On a lucky day, when everything goes right
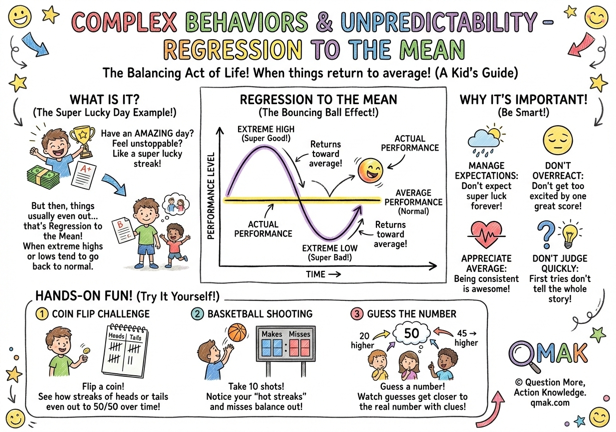
You feel unstoppable, like you’re taking flight
But as time goes on, things start to even out
Regression to the mean, it’s what life’s about

(Chorus)
Regression to the mean, it’s a balancing act
Extremes don’t last forever, that’s a simple fact
Good luck, bad luck, they come and go
But in the end, it’s the average that shows

(Verse 2)
Skill and chance, they both play a part
In the outcomes we see, from the very start
When luck takes over, results can be extreme
But regression to the mean, brings us back to the scene

(Bridge)
Managing expectations, not overreacting too
Appreciating consistency, in all that we do
Not judging too quickly, based on just one try
Regression to the mean, it’s a principle to live by

(Chorus)
Regression to the mean, it’s a balancing act
Extremes don’t last forever, that’s a simple fact
Good luck, bad luck, they come and go
But in the end, it’s the average that shows

(Verse 3)
Flipping coins, shooting hoops, guessing numbers too
Hands-on learning, helps us see the truth
Streaks may happen, but they don’t define
The overall picture, the average over time

(Bridge)
So when you’re riding high, on a wave of success
Remember regression to the mean, it’s a concept to address
And when you’re feeling low, after a streak of bad
Know that balance will return, it’s not forever sad

(Chorus)
Regression to the mean, it’s a balancing act
Extremes don’t last forever, that’s a simple fact
Good luck, bad luck, they come and go
But in the end, it’s the average that shows

(Outro)
Embrace the ebb and flow, the highs and lows of life
Regression to the mean, it cuts through like a knife
Reminding us to stay grounded, no matter the scene
And appreciate the balance, of the in-between!